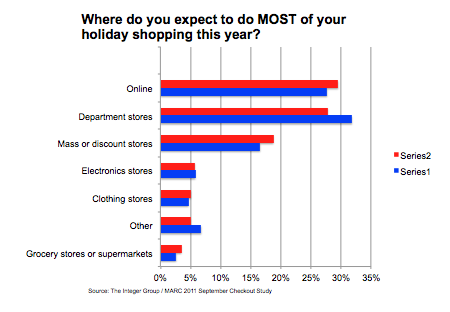
Recent data from our Checkout survey unveiled interesting data pertaining to shopping intentions during the 2011 holiday season. In September soon-to-be holiday shoppers were asked where they planned to make most of their upcoming purchases. 30% reported they planned to make most of their purchases online. That was up from 28% in 2010. And for the first time, consumers reported they plan to shop online for most purchases (30%) rather than department stores (28%).
With a couple significant shopping days under our belt, we asked ourselves how does online shopping compare with brick and mortar this holiday season? Where are consumers doing most of their holiday shopping?
According to ComScore, online spending during the week ending on December 2nd set a new single-week record ($6 billion in sales). Online shopping on Thanksgiving day grew 18% to $479 million, Black Friday sales grew 26% to $816 million, and Cyber Monday sales grew 22% to $1.25 billion.According to the National Retail Federation, online sales should grow 15% this holiday season to 37.6 billion. Incidentally, total online sales in 2010 grew 15% from 2009. Online is experiencing double digit sales growth.
How does this compare to brick and mortar sales? NRF reported that consumers spent 11.4 billion onBlack Friday, of which $816 million was online. Therefore, roughly 8% of Black Friday sales were online purchases. This year, according to NRF, total brick-and-mortar sales may rise 2.8% to $465.6 billion. Therefore, brick and mortar made up 93% of sales in 2010 (versus 7% online) and 92% of sales in 2011 (versus 8% online).
It appears that both projected online holiday shopping and actual online sales demonstrate that its getting stronger and stronger. However, holiday shopping is still dominated by the brick and mortar retailers. Question is how with 15% online sales growth versus only 2.8% for brick and mortar, how long will that domination last?